Acoustic Pharyngometry – A new method to facilitate oral appliance therapy
International Journal of Pediatric Otorhinolaryngology
Authors: S. A. Xue, L. Kaine, M I. Ng
Abstract: AR technology has been extensively used as an objective diagnostic tool for locating structural and functional abnormalities within the oral and pharyngeal cavities, and in a variety of clinical applications, including (1) locating site and severity of vocal tract obstructions for patients with sleep apnea [45,46]; (2) establishing degree of nasal airway abnormalities [47,48]; and (3) determining optimal endotracheal tube positioning [41]; and (4) documenting changes in the vocal tract due to race and aging [33–35,49]. AR canbe a valuable alternative to other objective diagnostic techniques,such as MRI, fluoroscopy, or ultrasound, for assessment of the vocaltract, as the procedure is completely non- invasive and does notexpose the participants to radiation.
Comparative studies byD’Urzo et al. [50] and Marshall et al. [51] found that ARmeasurements could be used in lieu of MRI and CT for quantifyingsome aspects of vocal tract configurations
Despite the documented lumen abnormalities associated with Down syndrome, little is known about the oral and pharyngeal dimensional characteristics of these children. The objective of this study was to measure the vocal tract lumen of children with Down syndrome by using acoustic reflection (AR) technology
(Eccovision Acoustic Pharyngometer; Sensormedics Corp., Yorba Linda, CA). Specifically, the purposes of this study were to (1) quantify the vocal tract configurations of children with Down syndrome; (2) compare this data against that of typically developing children to determine if significant differences are observed between these two populations; (3) locate specific structural differences along the vocal tract, thereby indicating a potential relationship to speech and/or swallowing difficulties observed in children with Down syndrome; and (4) establish preliminary data of the vocal tract configuration for this population. The study applied non-invasive and cost-effective
AR technology that was quite suitable for similar studies that involved large numbers of participants, particularly older children with different types of disorder.
Pharyngometric measurements were obtained using an Eccovision Acoustic PharyngometerTM. This device consisted of two microphones and one sound generator mounted on a 30-cm-long,
1.89-cm inner diameter wave tube, and a microcomputer equipped with digital-to-analog and analog-to-digital converters for software and data processing. The use of AR technology has been demonstrated as a viable option for delineating the parameters of the human upper airway [39–44]. This procedure uses acoustic energies, which are transmitted through a tube into the airway. A fraction of the acoustic wave is reflected back at each point of discontinuity in the upper airway and is recorded by a microphone attached to the mouthpiece [43]. The other end of the transmitting tube is connected with the CPU that transforms the wave signal with algorithms into dimensional values shown on the monitor
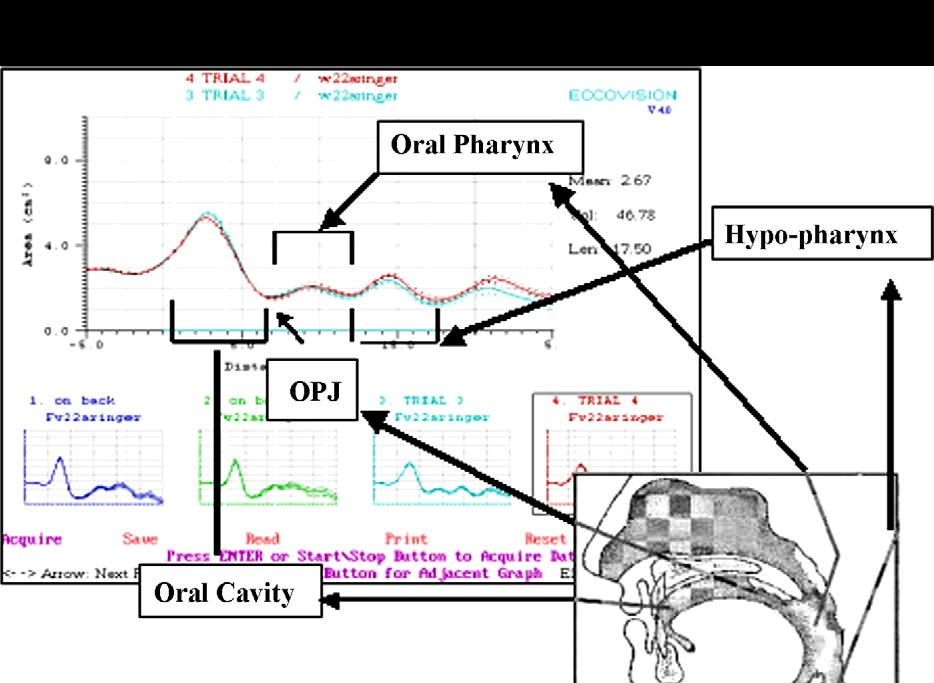
(see Fig. 1). The device underwent an automatic self-calibration as set by the manufacturer each time a participant was tested. The cross-sectional area of the vocal tract as a function of the distance from the lips to the glottis was plotted (see Fig. 2) according to the amplitude and arrival times of acoustic returns. The measured area–distance curves through mouth breathing, that correspond to major vocal tract morphological marks were selected for analysis according to the following criteria: (a) the oral pharyngeal juncture
(OPJ that refers to the velum area demarcating oral cavity and pharyngeal cavity) of the mouth-breathing curve best matched the OPJ of the nose-breathing curve, and (b) the curve fluctuated with the smallest magnitude due to airflow changes. The resultant volume–distance relationships were divided into two sections by hand-marking to separate the oral cavity from the pharyngeal cavity as outlined by the manufacturer, using the following standard criteria: an oral region extending from the incisors to the
anterior margin of OPJ and a pharyngeal region extending from the oral pharynx to the end of hypo-pharynx (the glottis) (Fig. 3). Six measured volume–distance curves were obtained for each participant: oral volume, pharyngeal volume, vocal tract volume
(in cubic centimeters), oral length, pharyngeal length and vocal tract length (in centimeters).
2.3. Testing procedures
In accordance with manufacturer’s guidelines, each participant was tested three times using the following procedure:
1. All subjects were tested while sitting upright in a chair while demonstrating good postural control and head support during normal tidal breathing.
2. A new, sanitized mouthpiece was selected for each participant and sized for optimal fit to prevent air leakage. The wave tube was positioned so that it was positioned parallel to the ground, creating a straight line to the pharyngometer.
3. Subjects were asked to focus on a certain point in space, which was indicated by a picture the researcher attached to the wall.
The researcher assisted the participant in sitting up straight and remaining still. The participant was then prompted to think silently of an “oooh” sound to relax the facial muscles, bring the tongue to a neutral position, and close the velum thereby preventing air leakage through the nasal cavity.
4. The clinician elicited three curves during normal mouth breathing. For those children who had difficulty of maintaining mouth breathing, the clinician would use index finger and thumb to approximate their nasal cavities towards the nasal septum to seal nasal breathing. The calculations of these curves
were averaged for each participant across the six VT parameters. Note: For one participant, only one valid trial was obtained; consequently, the values for this participant were not based on
an average of three trials.
Due to the difficulties of some participating Down syndrome children to follow the examiners’ directions of mouth breathing
during pharyngometric recording, the testing procedures were not
exactly consistent across all participants. However, the investigation demonstrated that AR technology could be used for large scale comparative studies of vocal tract configurations when it is not feasible to use MRI and other conventional imaging technologies. The findings of the study motivated the speech pathologists to develop new therapies with the aim of enhancing the compromised mobility of the articulators within smaller oral cavities of Down syndrome children.
Fig. 3. Area–distance curve of vocal tract dimensions from a pharyngometer. Note: Pharyngeal cavity is calculated by combining oral pharynx and hypo-pharynx.
Related posts


